

The UK is only half as good as it thinks it is at reducing CO2 emissions.
For the past 12 years the Department of Energy & Climate Change (DECC) has published the “Alternative approaches to reporting UK Greenhouse Gas Emissions” report – an insightful paper that helps codify “embedded emissions” – greenhouse gases generated from trade imports.
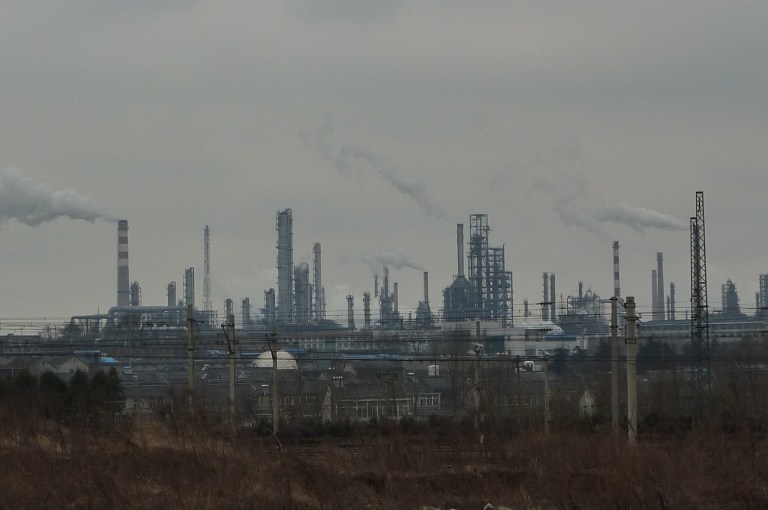
The report shows how the burden of gas emissions, generated from the UK’s demand for commodities, is added to the CO2 bill of the manufacturing countries like China and India.
Within the DECC’s own paper, the UK’s embedded emissions records a 50% higher carbon footprint than those based on the UN Framework Convention on Climate Change criteria.

So who really is guilty of increasing carbon emissions?
It may seem logical to foot the carbon bill with the economy creating the product, but when embedded emissions are not counted, this startling carbon-disguise highlights a serious failing in data representation.
If a disproportionate attribution of blame is given to emerging economies, then the counter-argument – that they are only filling the demand created by the UK – is a concrete rebuttal.
The Private Eye reported that Professor Michael Jefferson, Melchbourne, Beds, said: “If those embedded emissions are included, then in the year 2000 they were 42.7% higher that those based on the UN’s framework.
“In 2005 they were 58.1% higher, in 2010 49.9% higher, in 2011 52.7% higher, and in 2012 it was 49.4% higher [than the UN’s climate change criteria.]”
Ganjiaxiang, China
When asked by Climate Messenger about the report, a spokesman for the department said:
“The ‘Alternative approaches to reporting UK Greenhouse Gas Emissions’ report will continue to be published on a periodic basis as long as source data are available from the ONS and DEFRA.
“The current report is up to date and uses the latest data available.
“When these source datasets are published with more up to data numbers we will re-publish our report to take these into account.
“Typically this is done when data from all 3 sources is available for the latest given year, currently this is 2012, as whilst ONS and DECC data are available for 2013, the latest year covered by DEFRA Carbon Footprint statistics is 2012.
“When new data become available we will update our report.”
